Performance & Debugging
Click and touch events
Right-click blocking is not needed as this is a mobile app. Please don't block the context menu / right-click event, as it is used during debugging.
// DON'T do this!
window.addEventListener('contextmenu', event => event.preventDefault());
Likewise, your module may be run on desktop for debugging, so it's best to support both touch and click events. If you use TouchEvent please check for its presence first to avoid errors:
if (window.hasOwnProperty('TouchEvent')) {
    window.addEventListener('touchstart', () => {
        //....
    });
}
Framerate limiting
The Oooh app runs at 30fps, but the web view your module runs in is not locked to 30fps, and will try to run up to 60fps. To improve battery life and reserve processing power for advanced features like speech recognition and body tracking, we may request that you throttle your module's frame rate, usually to 30-50fps.
If you are not using an engine with built-in support for changing the framerate, we recommend you do this by replacing window.requestAnimationFrame. You can use this snippet, replacing FPS with the desired framerate:
const raf = window.requestAnimationFrame;
window._requestAnimationFrame = raf;

const FPS = 30;
let lastFrameTimestamp = 0;
window.requestAnimationFrame = callback => {
  const wrapper = timestamp => {
    if (timestamp >= lastFrameTimestamp + 1000 / FPS) {
      lastFrameTimestamp = timestamp;
      callback.call(window, timestamp);
    } else {
      raf(wrapper);
    }
  };
  return raf(wrapper);
}
Debug configuration performance profiling
We recommend that you include some performance profiling tools in your module. If you're using toggles like "debugging mode" or "god mode" during your development and testing, please keep them compiled in, and allow them to be turned on and off with getConfigValue(). These module config values can be set in the SDK when you run the module.
const DEBUG_MODE = !!o3h.Instance.getConfigValue('debug');
To help profile performance issues, use a profiler like stats.js (stats-js on npm), and show it when debugging mode is on. You can use it in combination with GStats (gstats on npm) which makes integrating with a few game engines very simple, for example with PIXI:
import * as GStats from 'gstats';
import * as statsjs from 'stats.js';

// during initialization
this.app = new PixiApplication({ ... });
if (DEBUG_MODE) {
    // Export globally
    window.Stats = statsjs;
    const stats = new GStats.StatsJSAdapter(new GStats.PIXIHooks(this.app));
    document.body.appendChild(stats.stats.dom);
}

// in your update loop
if (DEBUG_MODE) {
    stats.update();
}
PlayCanvas recommends mini-stats which can be used in PlayCanvas builds, see the link for instructions.
Profiling your code
iOS
Use Safari on Mac to debug modules running on iPhone.
- Connect your phone via USB
- On your Mac, open Safari, then go to Safari > Preferences.
- Click Advanced and click Show Develop menu in menu bar at the bottom of the window. Close the window.
- On your iPhone, go to Settings > Safari > Advanced.
- Press the toggle for Web Inspector.
Run the module on your phone and on Safari use Develop > iPhone > Something like “Oooh SDK / module.oooh.io — index.html”. Using “Delay load” is a good way to catch the module initialization.
There is an excellent and authoritative guide at
Timelines Tab
Performance monitoring is in the “Timelines” Tab.

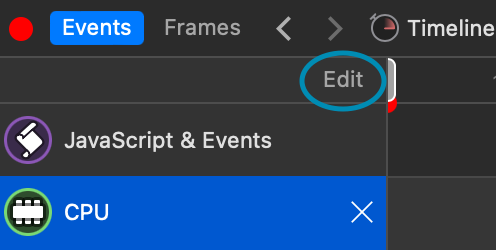
Buried “Edit” button
Use the Edit button here to choose what to profile: Most useful being JS & Events, CPU, and Memory.
To get info you’ll want to record a session - usually only for a short (less than 30 sec) period so it’s easier to digest and quicker for Safari to navigate through. Make it representative of what you are trying to investigate, like the main gameplay rather than menus. Use the 🔴 on the top left and then ⏹. The 🗑 on the top right can be used to clear.
Safari seems to crash after recording long sessions. Keep it short and representative. Quit and restart Safari AND Oooh to be able to debug modules again.
There are two views, Events and Frames. Events provides a better high-level overview of CPU use and Frames provides a better view of the framerate.
Choose a single frame or a subset of the recording by clicking and dragging in the timeline, or keep it unselected to analyze the entire duration.

Clicking the rows presents different information in the lower half. Here CPU is selected.

This is a very rough overview of how much CPU is being used by the browser — the “Average CPU” should be % of the system in use by the module’s web view (not including any Oooh-side things, or other processes, but including all browser processes not just JavaScript). On the left is a breakdown of that utilization; this always adds up to 100%. So high percentage of JS on the left doesn’t mean JS is using a lot of CPU, it means it’s responsible for a lot of the current CPU use, which is indicated on the right.
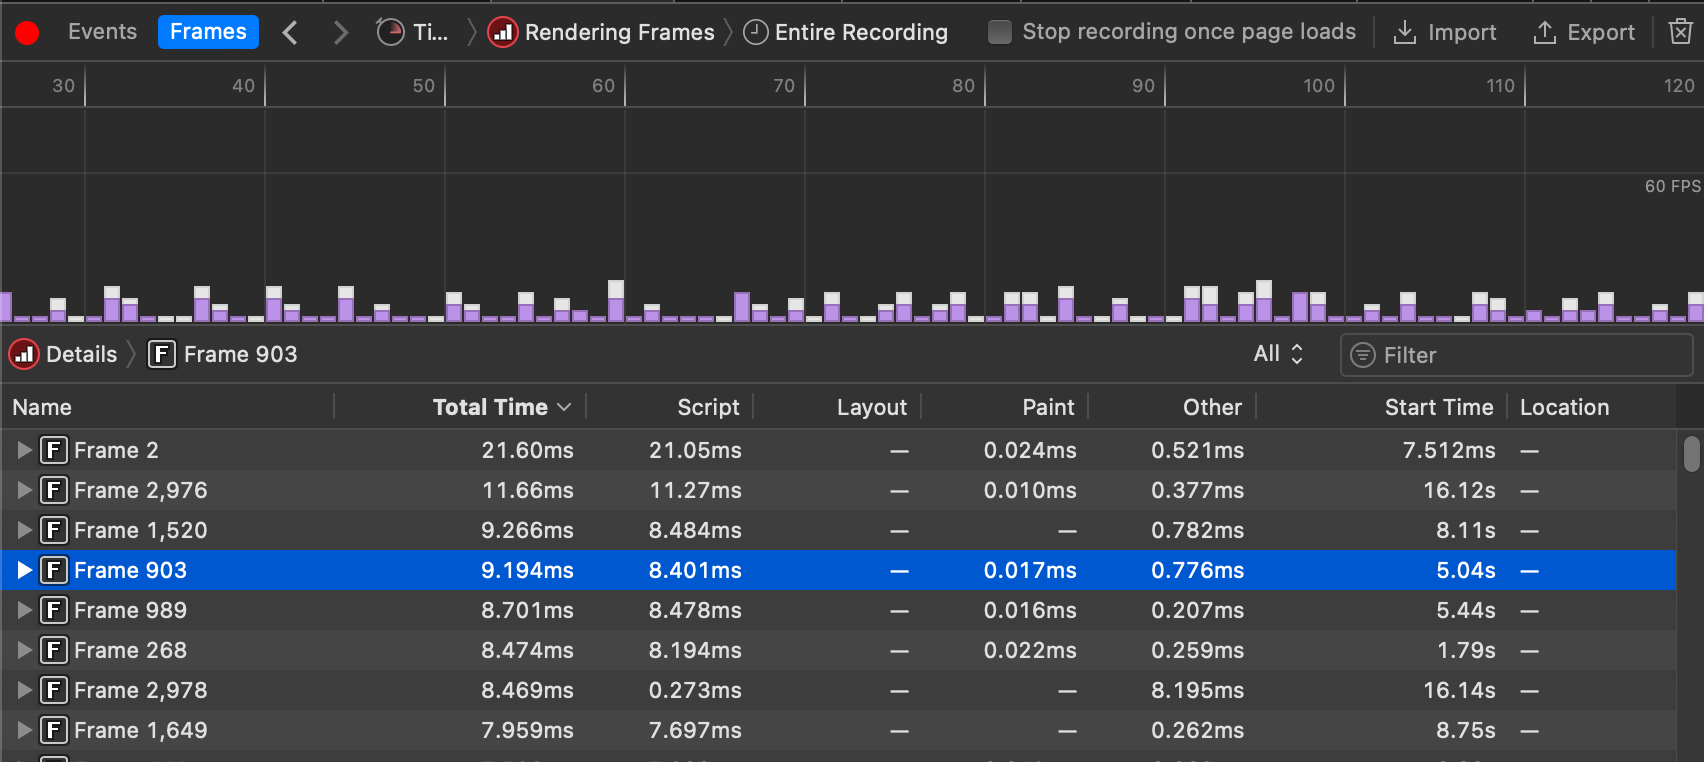
To check framerate, Use the “Frames” tab.

On the top, each frame is a bar representing how long it took to draw. Lower is better, and guides may be drawn for 30/60fps. Here, we’re under the 60fps bar so we’re exceeding 60fps. On the bottom, you get a list of all frames. You can narrow that down to slow frames under the “All” dropdown next to the Filter, and you can click column headers to sort by frame render time.
When you identify long running tasks or slow frames, you can then dig down into the call trees to identify where time is being spent, and thus find areas to improve your JavaScript.
Android
Use Chrome on any PC to debug and profile modules running on Android.
Follow the steps at ![]() Remote debug Android devices - Chrome Developers
Remote debug Android devices - Chrome Developers
- Open the Developer Options screen on your Android. See Configure On-Device Developer Options.
- Select Enable USB Debugging.
- On your development machine, open Chrome.
- Go to
chrome://inspect#devices. - Make sure that the Discover USB devices checkbox is enabled.
- Connect your Android device directly to your development machine using a USB cable. Your Android device may ask you to confirm that you trust this computer. The first time you do this, you usually see that DevTools has detected an offline device. If you see the model name of your Android device, then DevTools has successfully established the connection to your device. Continue to Step 2.Figure 3. The Remote Target has successfully detected an offline device that is pending authorization
- If your device is showing up as Offline, accept the Allow USB Debugging permission prompt on your Android device.
Run the module, then it should appear in this list, and click its “inspect” link:

Performance monitoring is in the “Performance” Tab.
There is an excellent and authoritative guide at
Performance features reference - Chrome Developers
To get info you’ll want to record a session - usually only for a short (less than 30 sec) period so it’s easier to digest and quicker for Chrome to navigate through. Make it representative of what you are trying to investigate, like the main gameplay rather than menus. Use the 🔴 on the top left and then hit stop on the dialog when done. The 🗑 on the top right can be used to clear.
Choose a single frame or a subset of the recording by clicking and dragging in the timeline, or keep it unselected to analyze the entire duration.

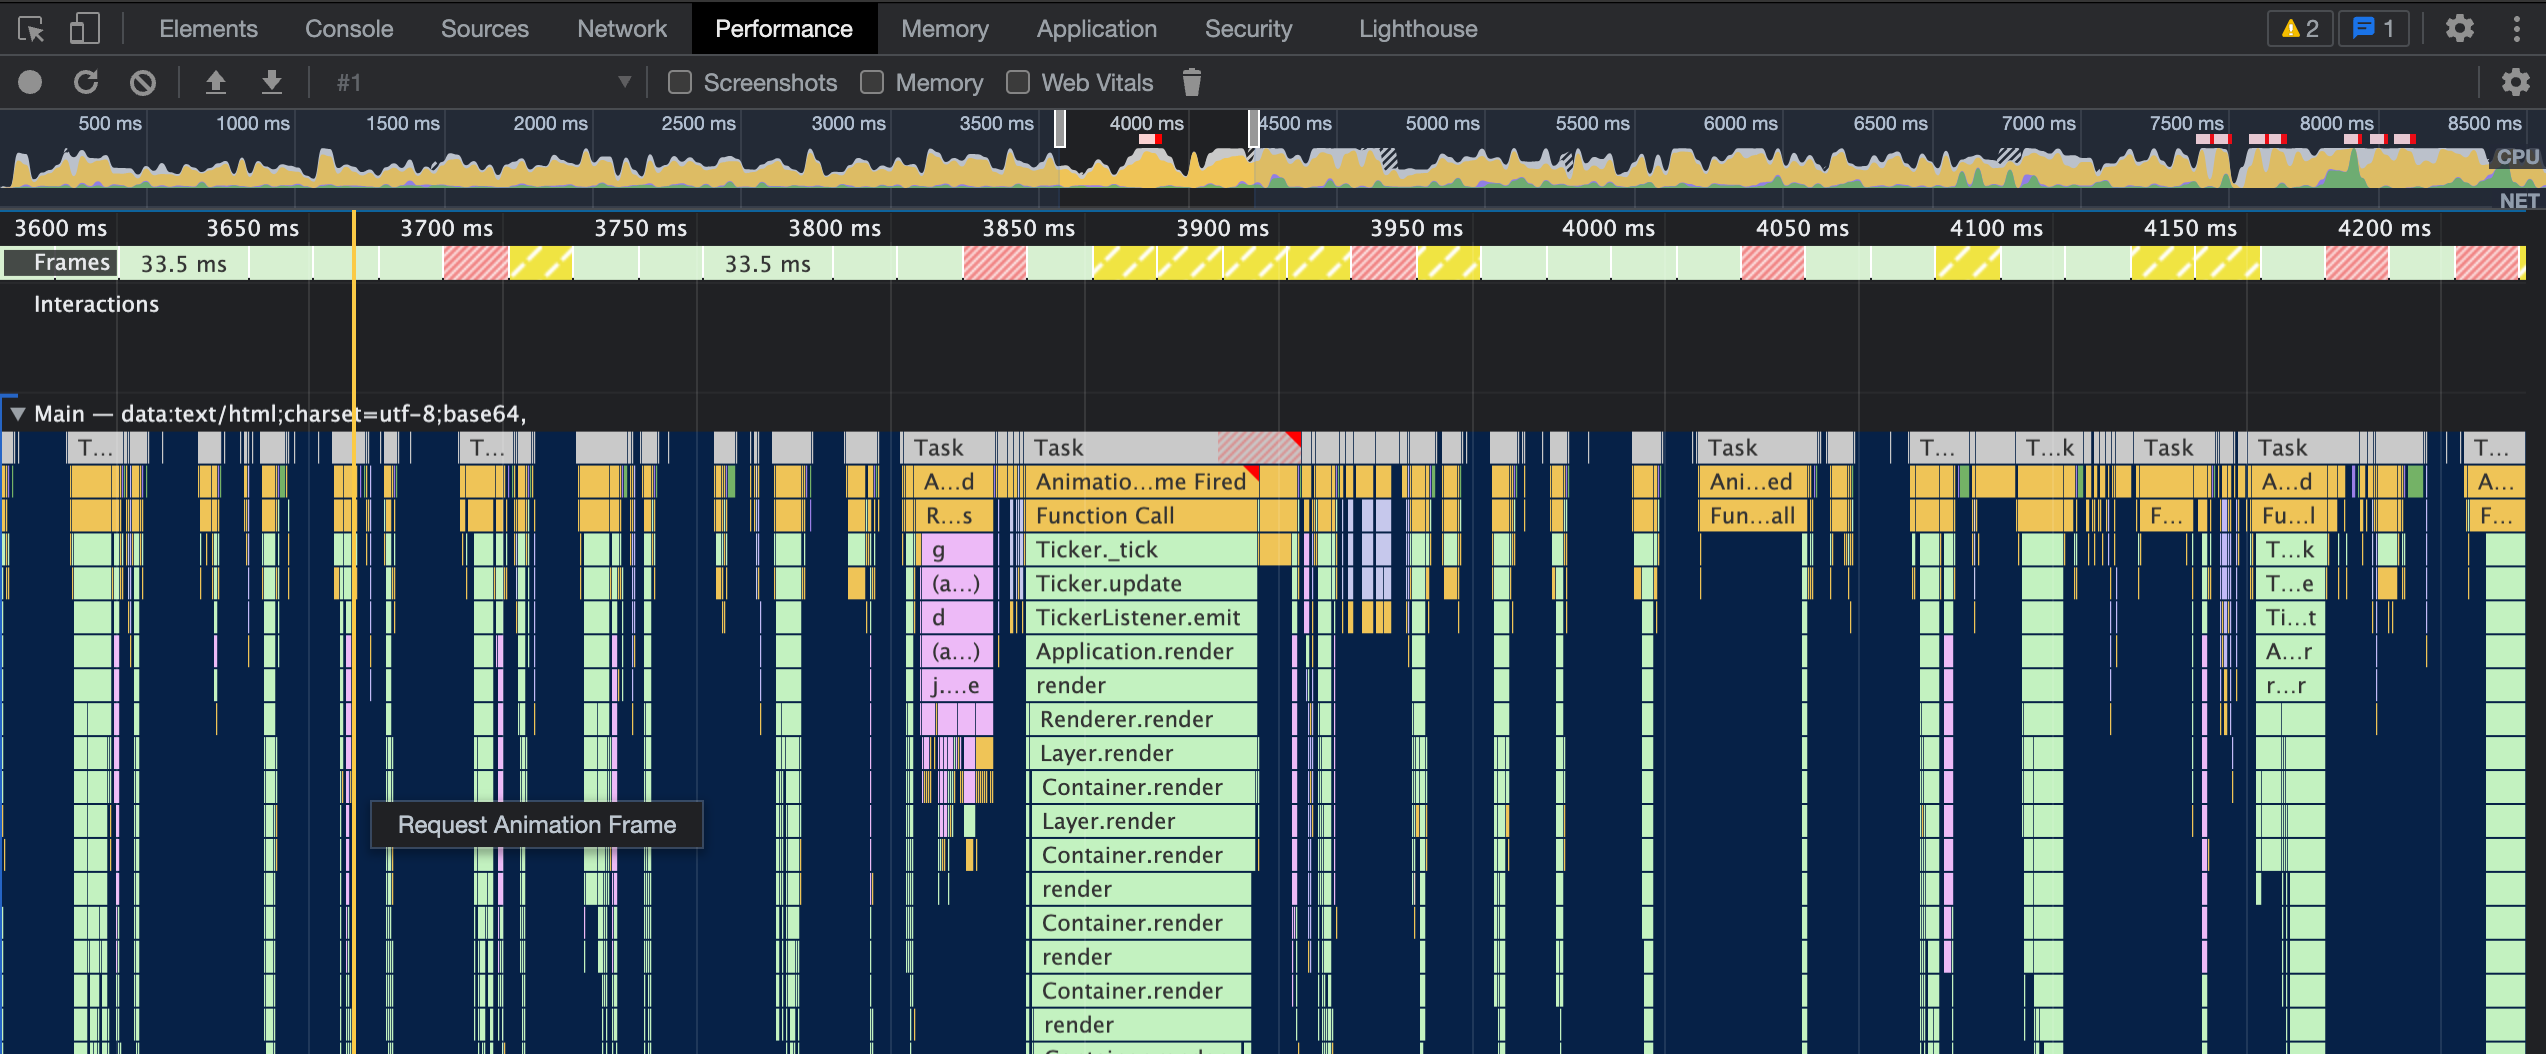
The top row labeled “CPU” on the right shows overall CPU usage. The very short bars at the very top highlight long running tasks in red.
Below that, the Frames bar shows an average framerate (divide 1000 ms / the frame duration, e.g. 33.5ms to get the framerate, but easy to keep in mind that 16.6ms is 60fps, and 33.3ms is 30fps.) The red frames show dropped frames. (The yellow “Partially presented frames” are explained here ![]() What's New In DevTools (Chrome 100) - Chrome Developers )
What's New In DevTools (Chrome 100) - Chrome Developers )
When you identify long running tasks or slow frames, you can then dig down into the call trees to identify where time is being spent, and thus find areas to improve your JavaScript.
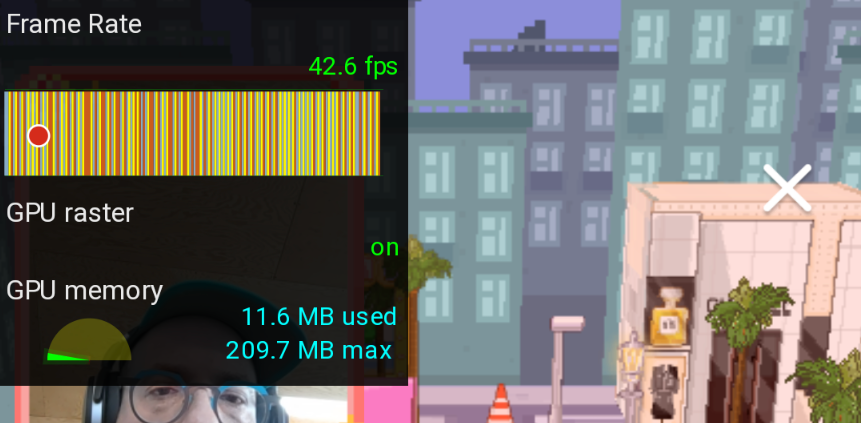
Even better, there’s an awesome HUD you can enable that shows drawing stats including framerate. It appears on top of the module on device.

To turn this on:
- Press Command+Shift+P (Mac) or Control+Shift+P (Windows, Linux, ChromeOS) to open the Command Menu.
- Start typing
rendering, select Show Rendering, and press Enter. DevTools displays the Rendering tab at the bottom of your DevTools window. - Check the checkbox for “Frame Rendering Stats”
Updated almost 2 years ago
